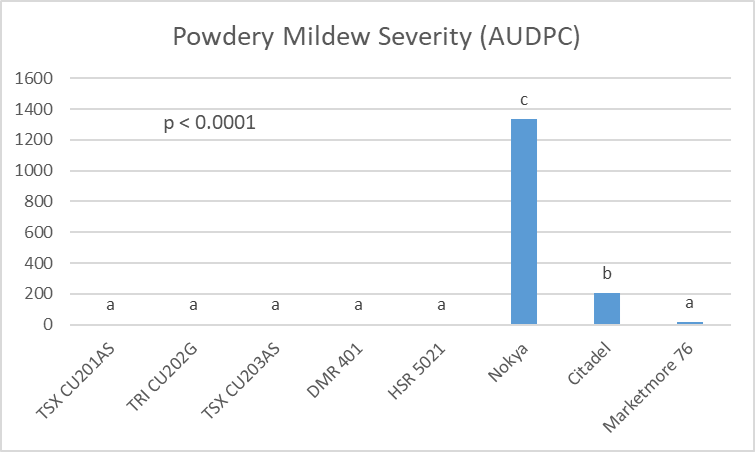
The experiment was conducted at the University of Massachusetts Research and Education Farm in Deerfield, MA in a field with soil classified as Hadley silt loam. Cucumber seeds were sown on 5 Jun in the greenhouse in 50-cell flats. Raised black plastic-mulched beds with one drip irrigation line were formed on 29 Jun and the beds were irrigated to moisten soil ahead of planting due to drought conditions. Seedlings were transplanted by hand on 29 Jun. During the season, water was provided as needed via drip irrigation. Weeds were controlled between mulched rows by hand or by mechanical cultivation. Cucumber beetles were managed with Wrangler (12 fl oz/A) applied through the dripline at planting. Plants were fertilized through the drip lines using 40 lb N/A of calcium nitrate (YaraLiva 15.5-0-0) at planting and again on 3 Jul. Plots were single 10-ft rows with 6 plants at 18-in. spacing. Rows were 20-ft apart. The plots were 10-ft apart within the row. A randomized complete block design with four replications was used. Occurrence of downy (DM) and powdery mildews (PM) was assessed by estimating incidence of symptomatic leaves in each plot and rating severity on ten representative symptomatic leaves. Ratings were made on 31 Jul; 7, 14, 21 and 28 Aug; and 4 Sep. Additional ratings were made on 11 Sep for TSX CU201AS, Nokya, and Citadel, which were the only varieties left with green tissue. Disease severity data was used to calculate area under the disease progress curve (AUDPC). Marketable sized fruit were harvested from the plants twice weekly from 31 Jul through 11 Sep and total and marketable yields were recorded. Fruit was considered unmarketable if it was misshapen, had excessive bird or insect damage, or was diseased. Average monthly temperatures (°F) were 73.4 in Jul, 72.5 in Aug, and 64.9 in Sep. Rainfall (inches) was 6.02, 6.62, and 8.94 for these months, respectively. All data were analyzed by general linear model and means were compared using Fisher’s LSD (α = 0.05), except for PM AUDPC which did not meet model assumptions for normality and those data were analyzed using the Kruskal-Wallis non-parametric test and means were separated using Dunn’s test for multiple comparisons.
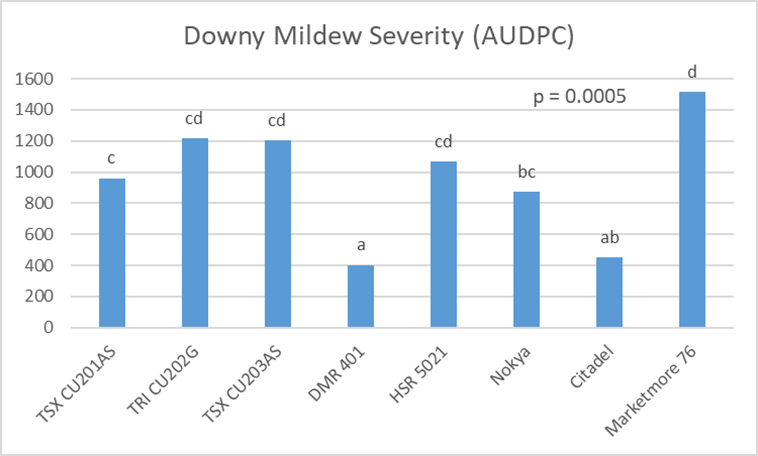
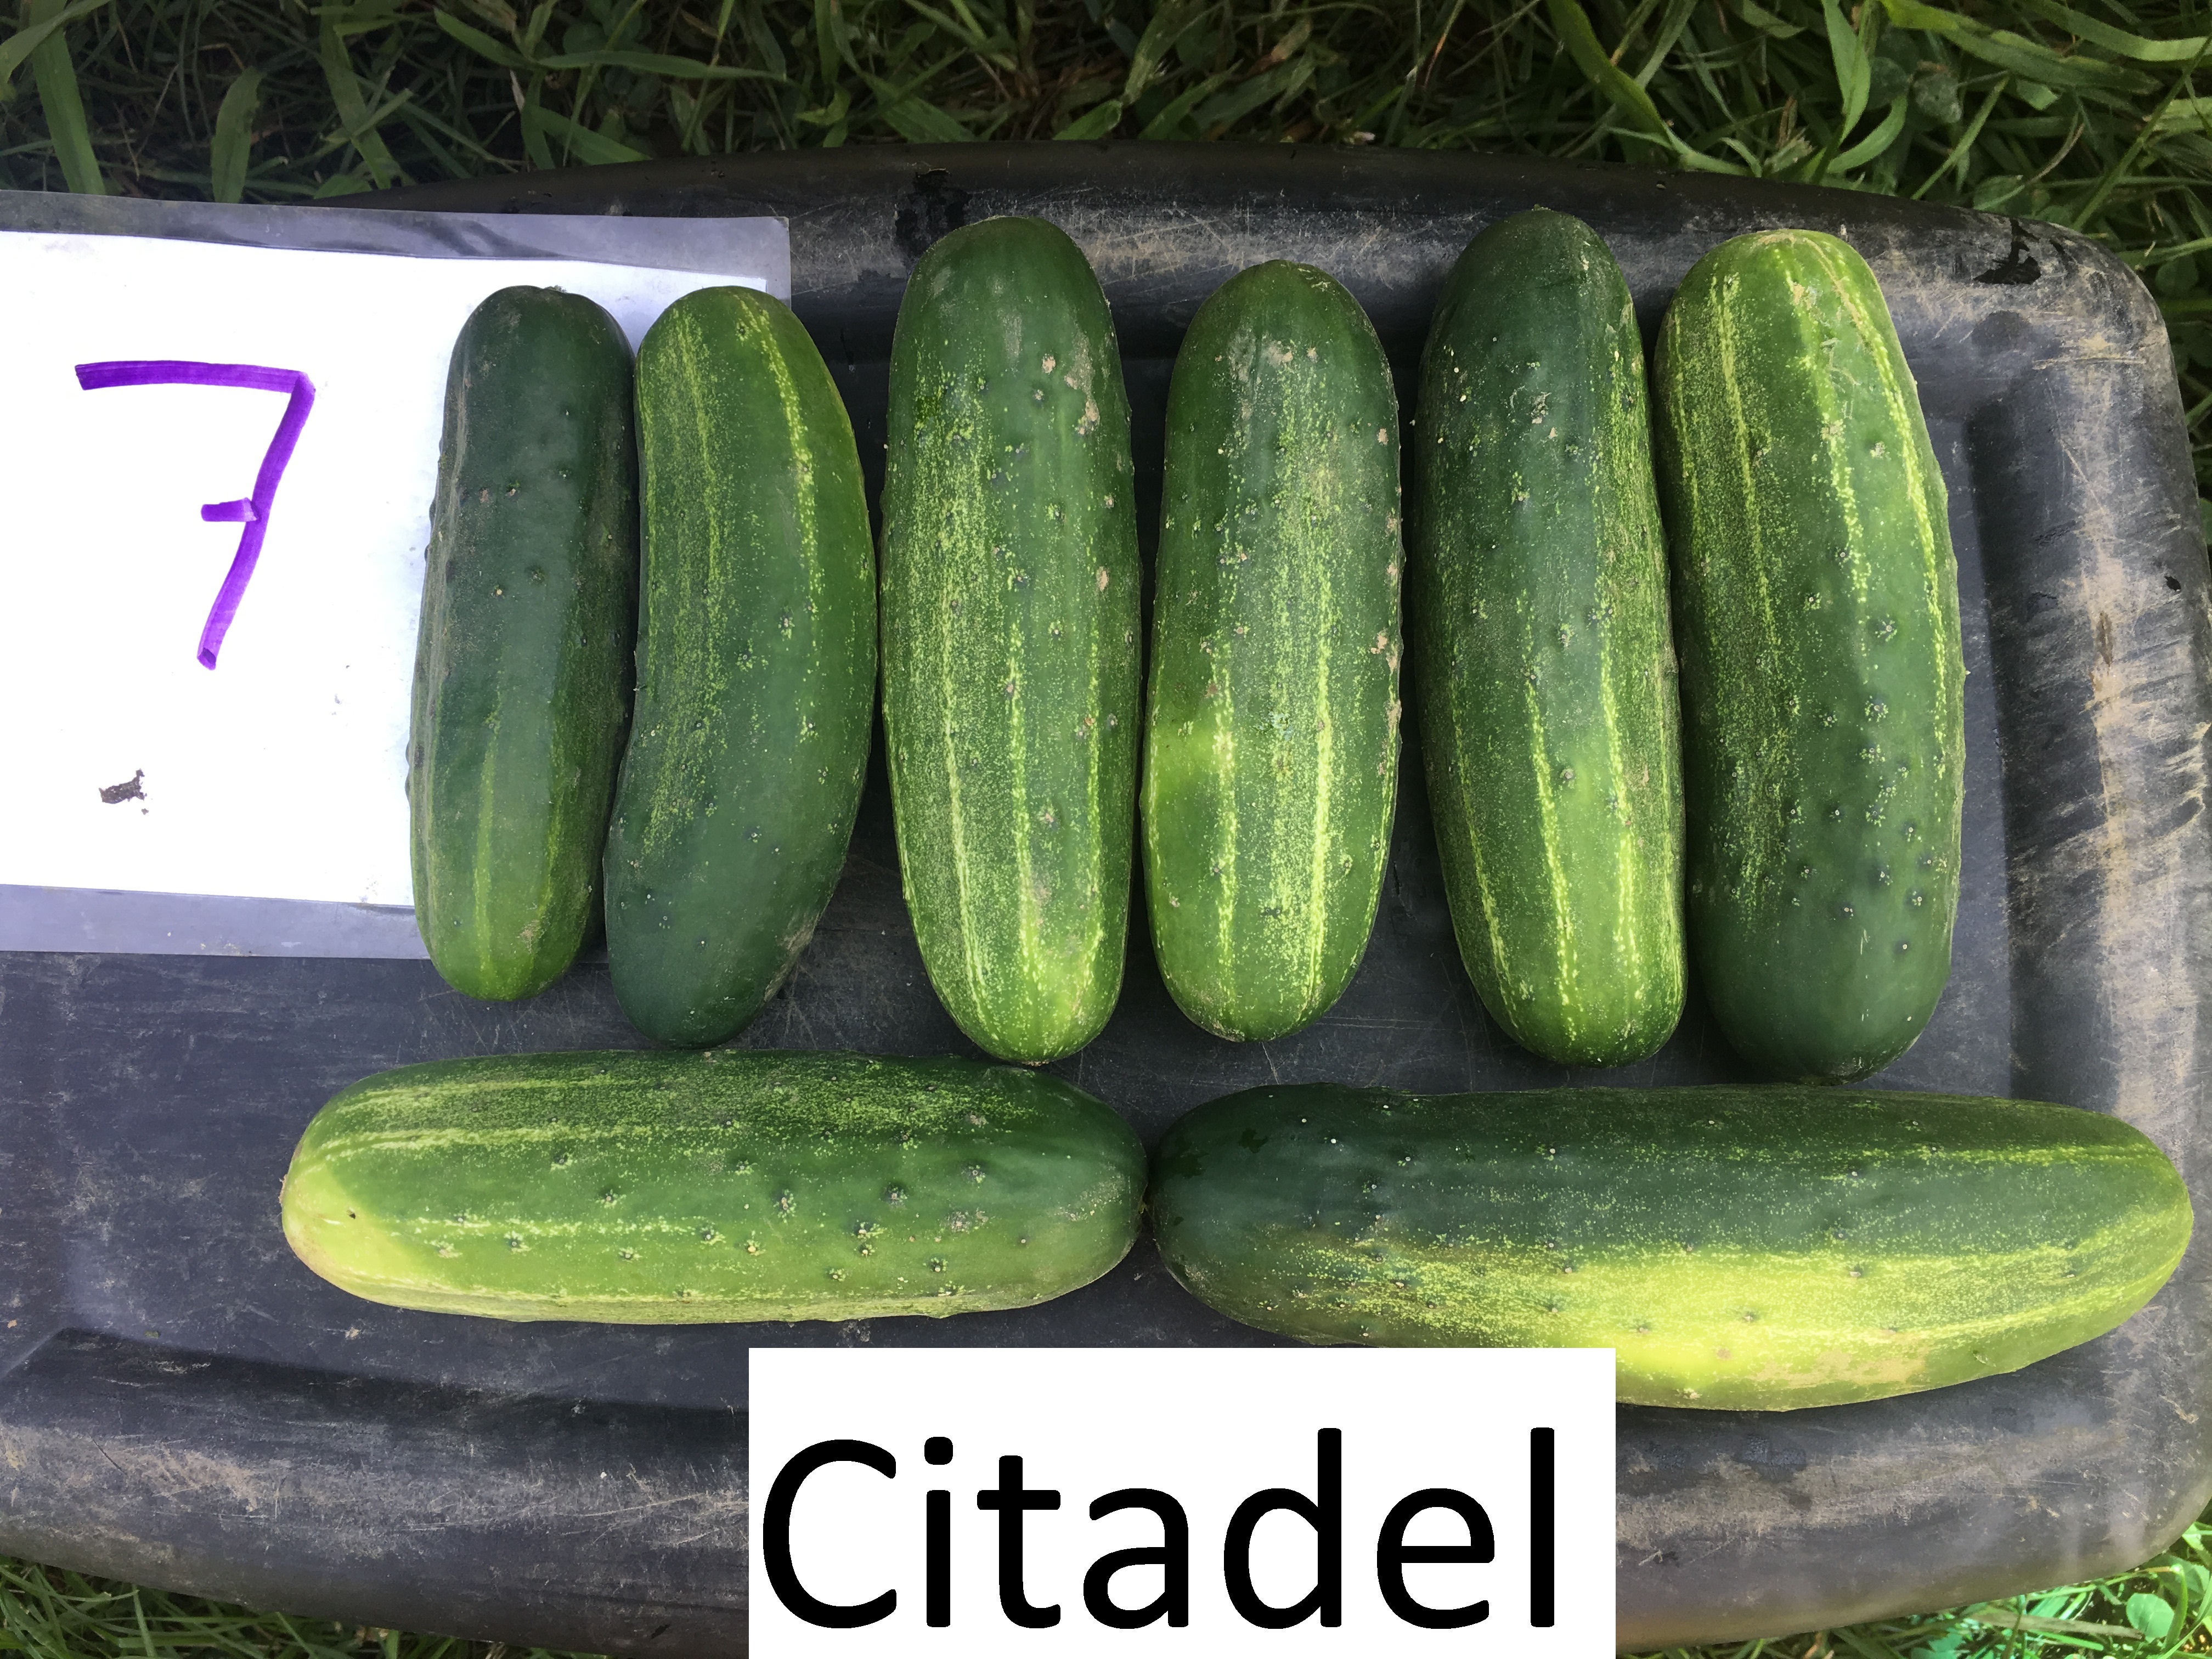
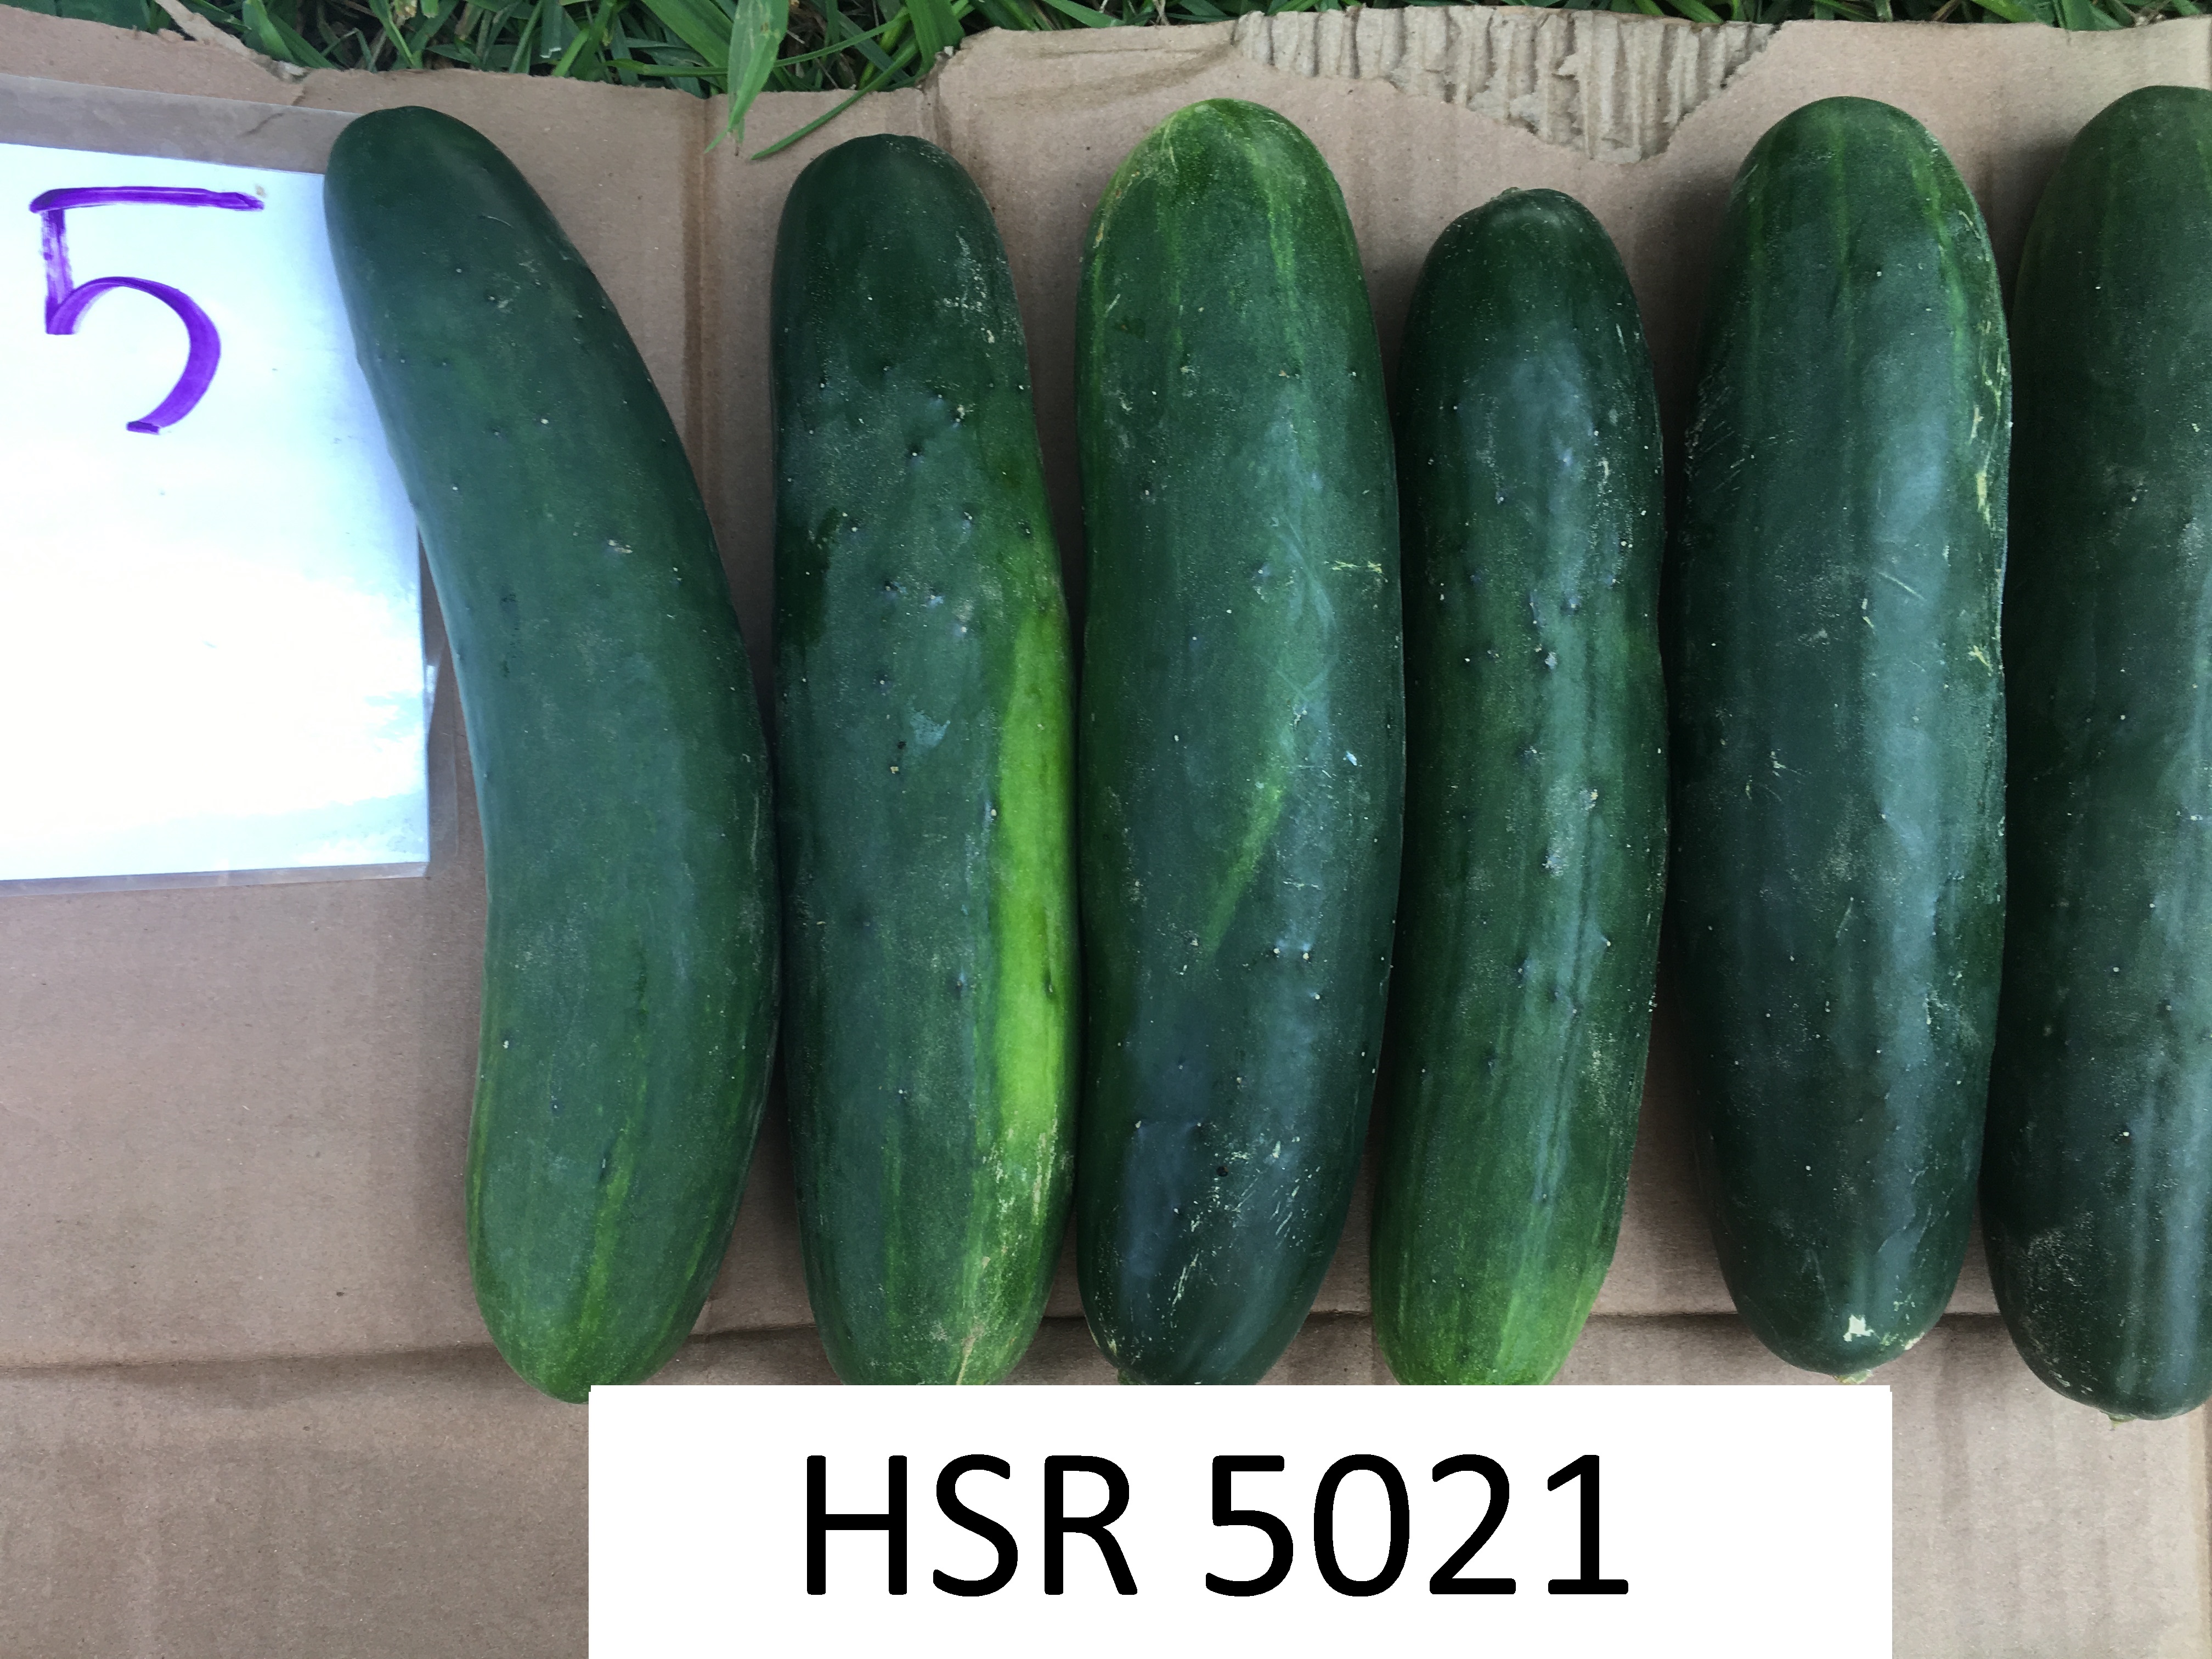
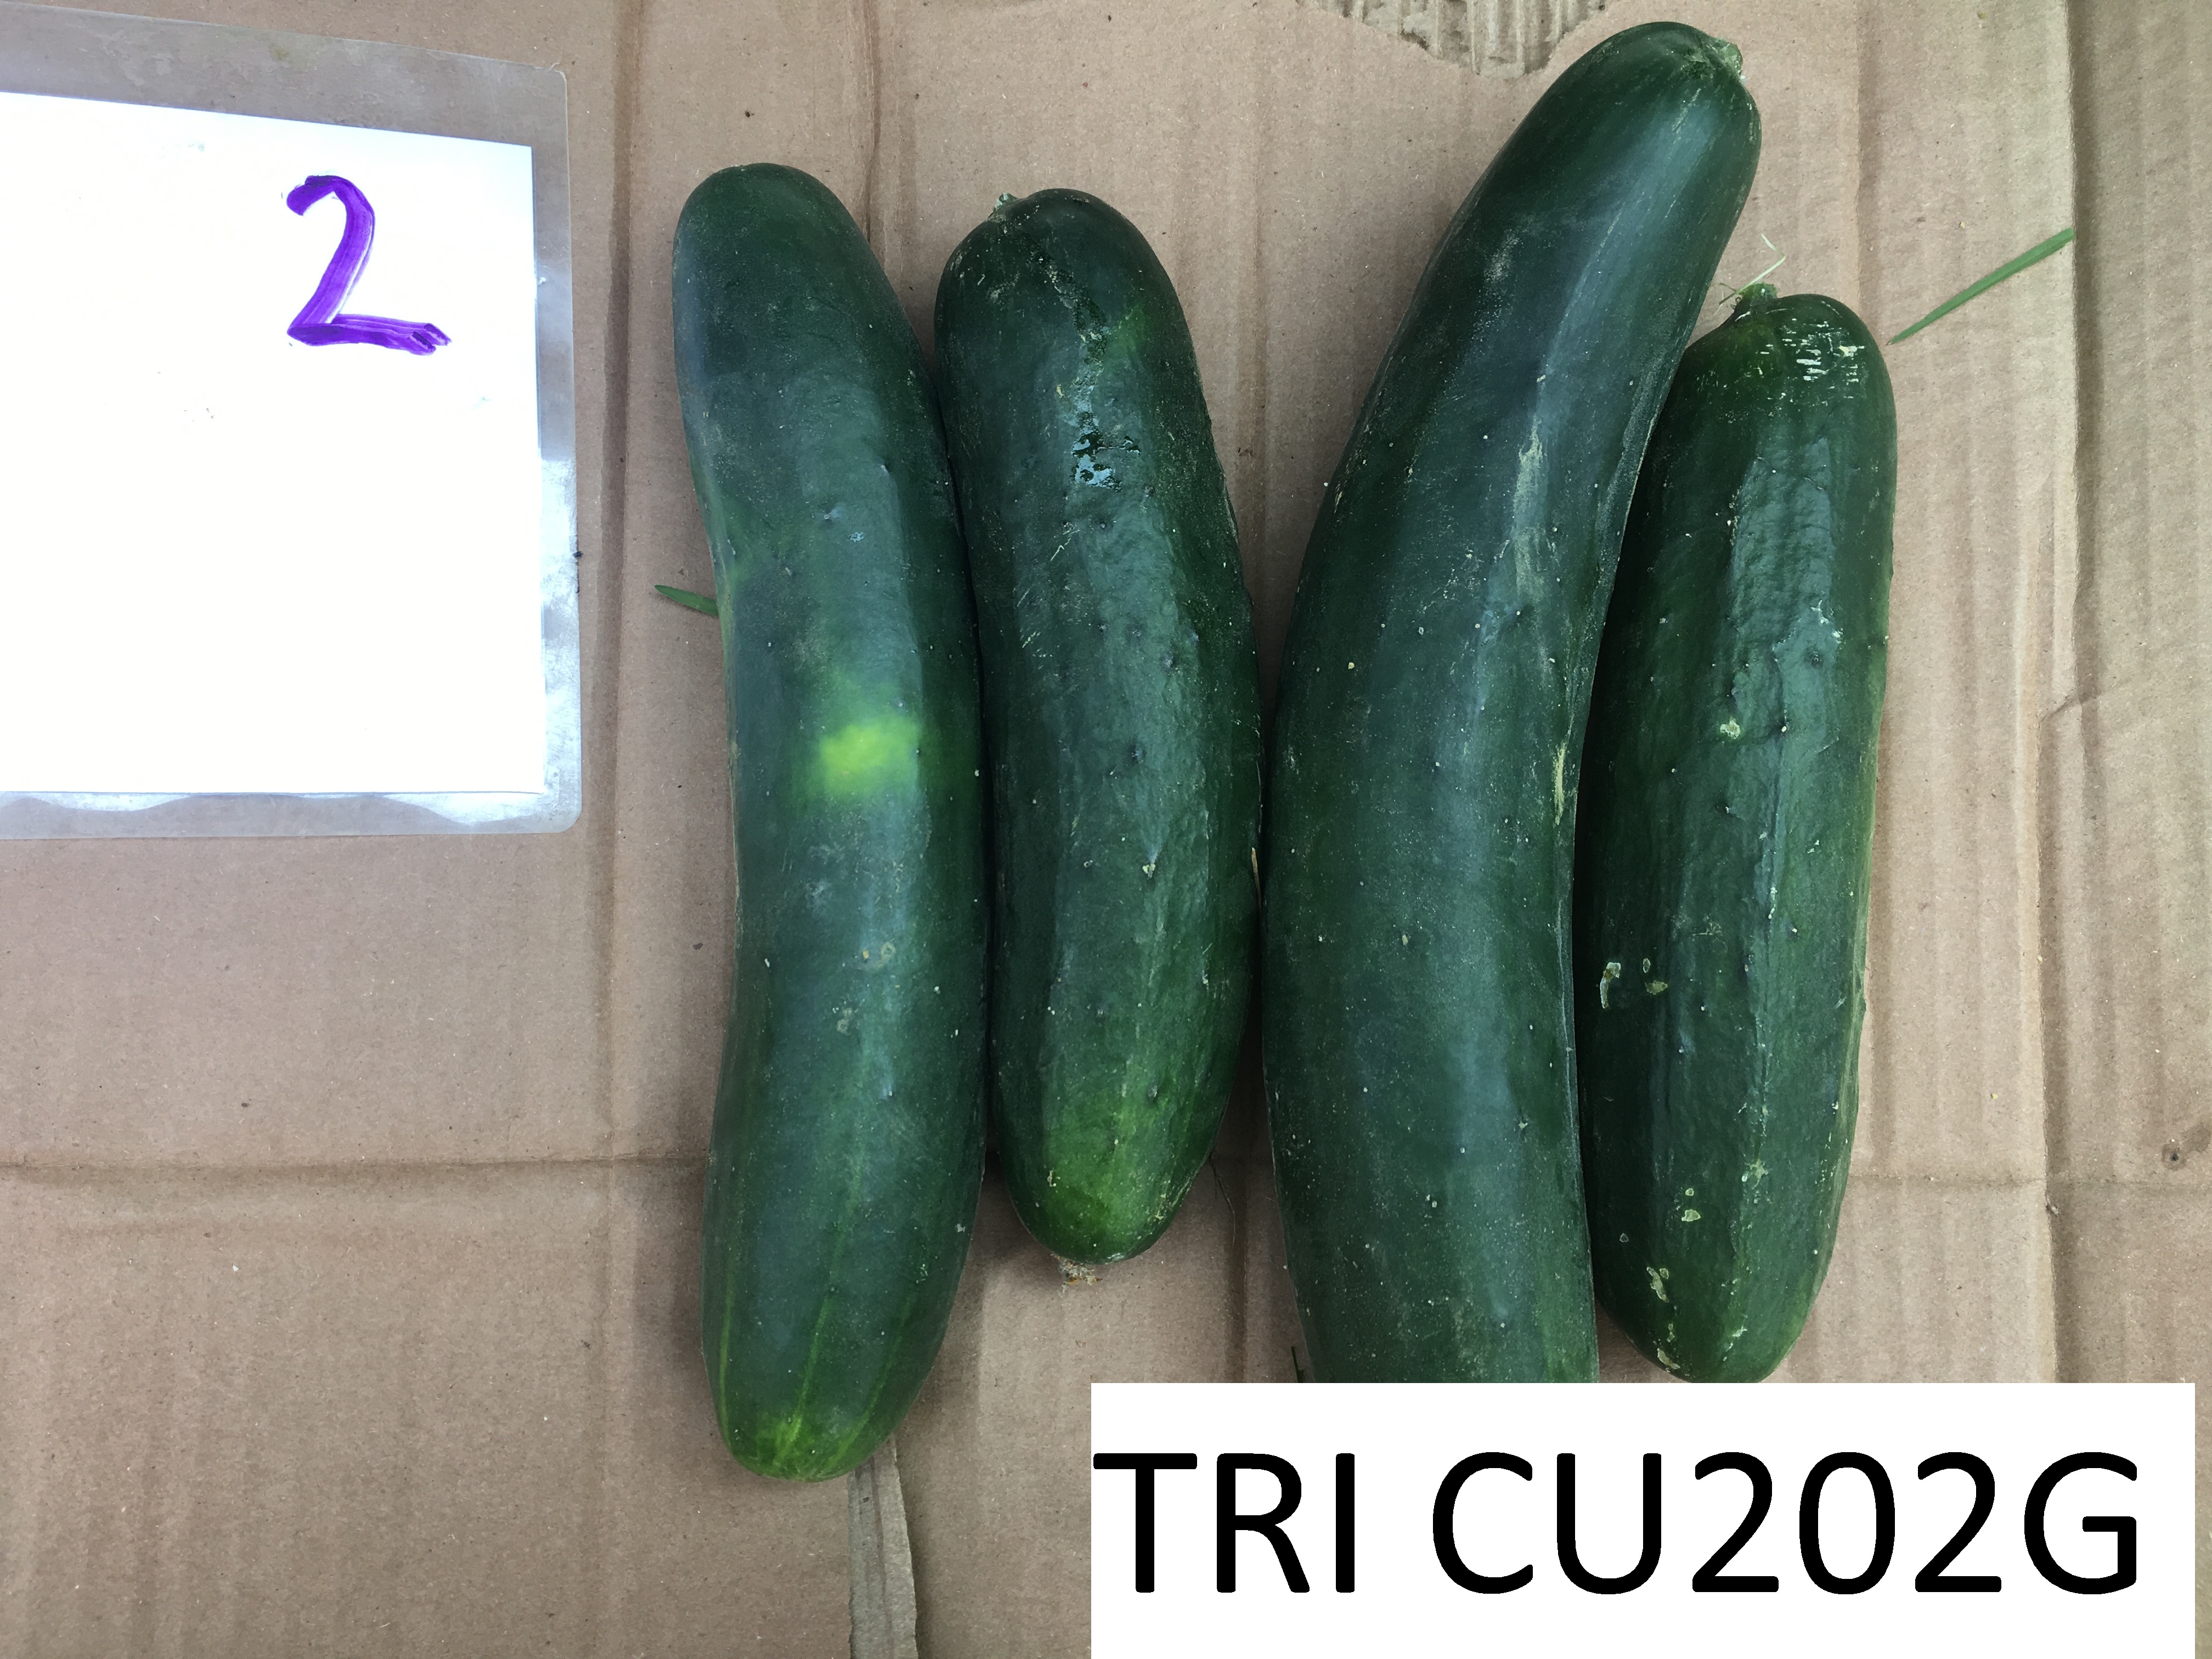
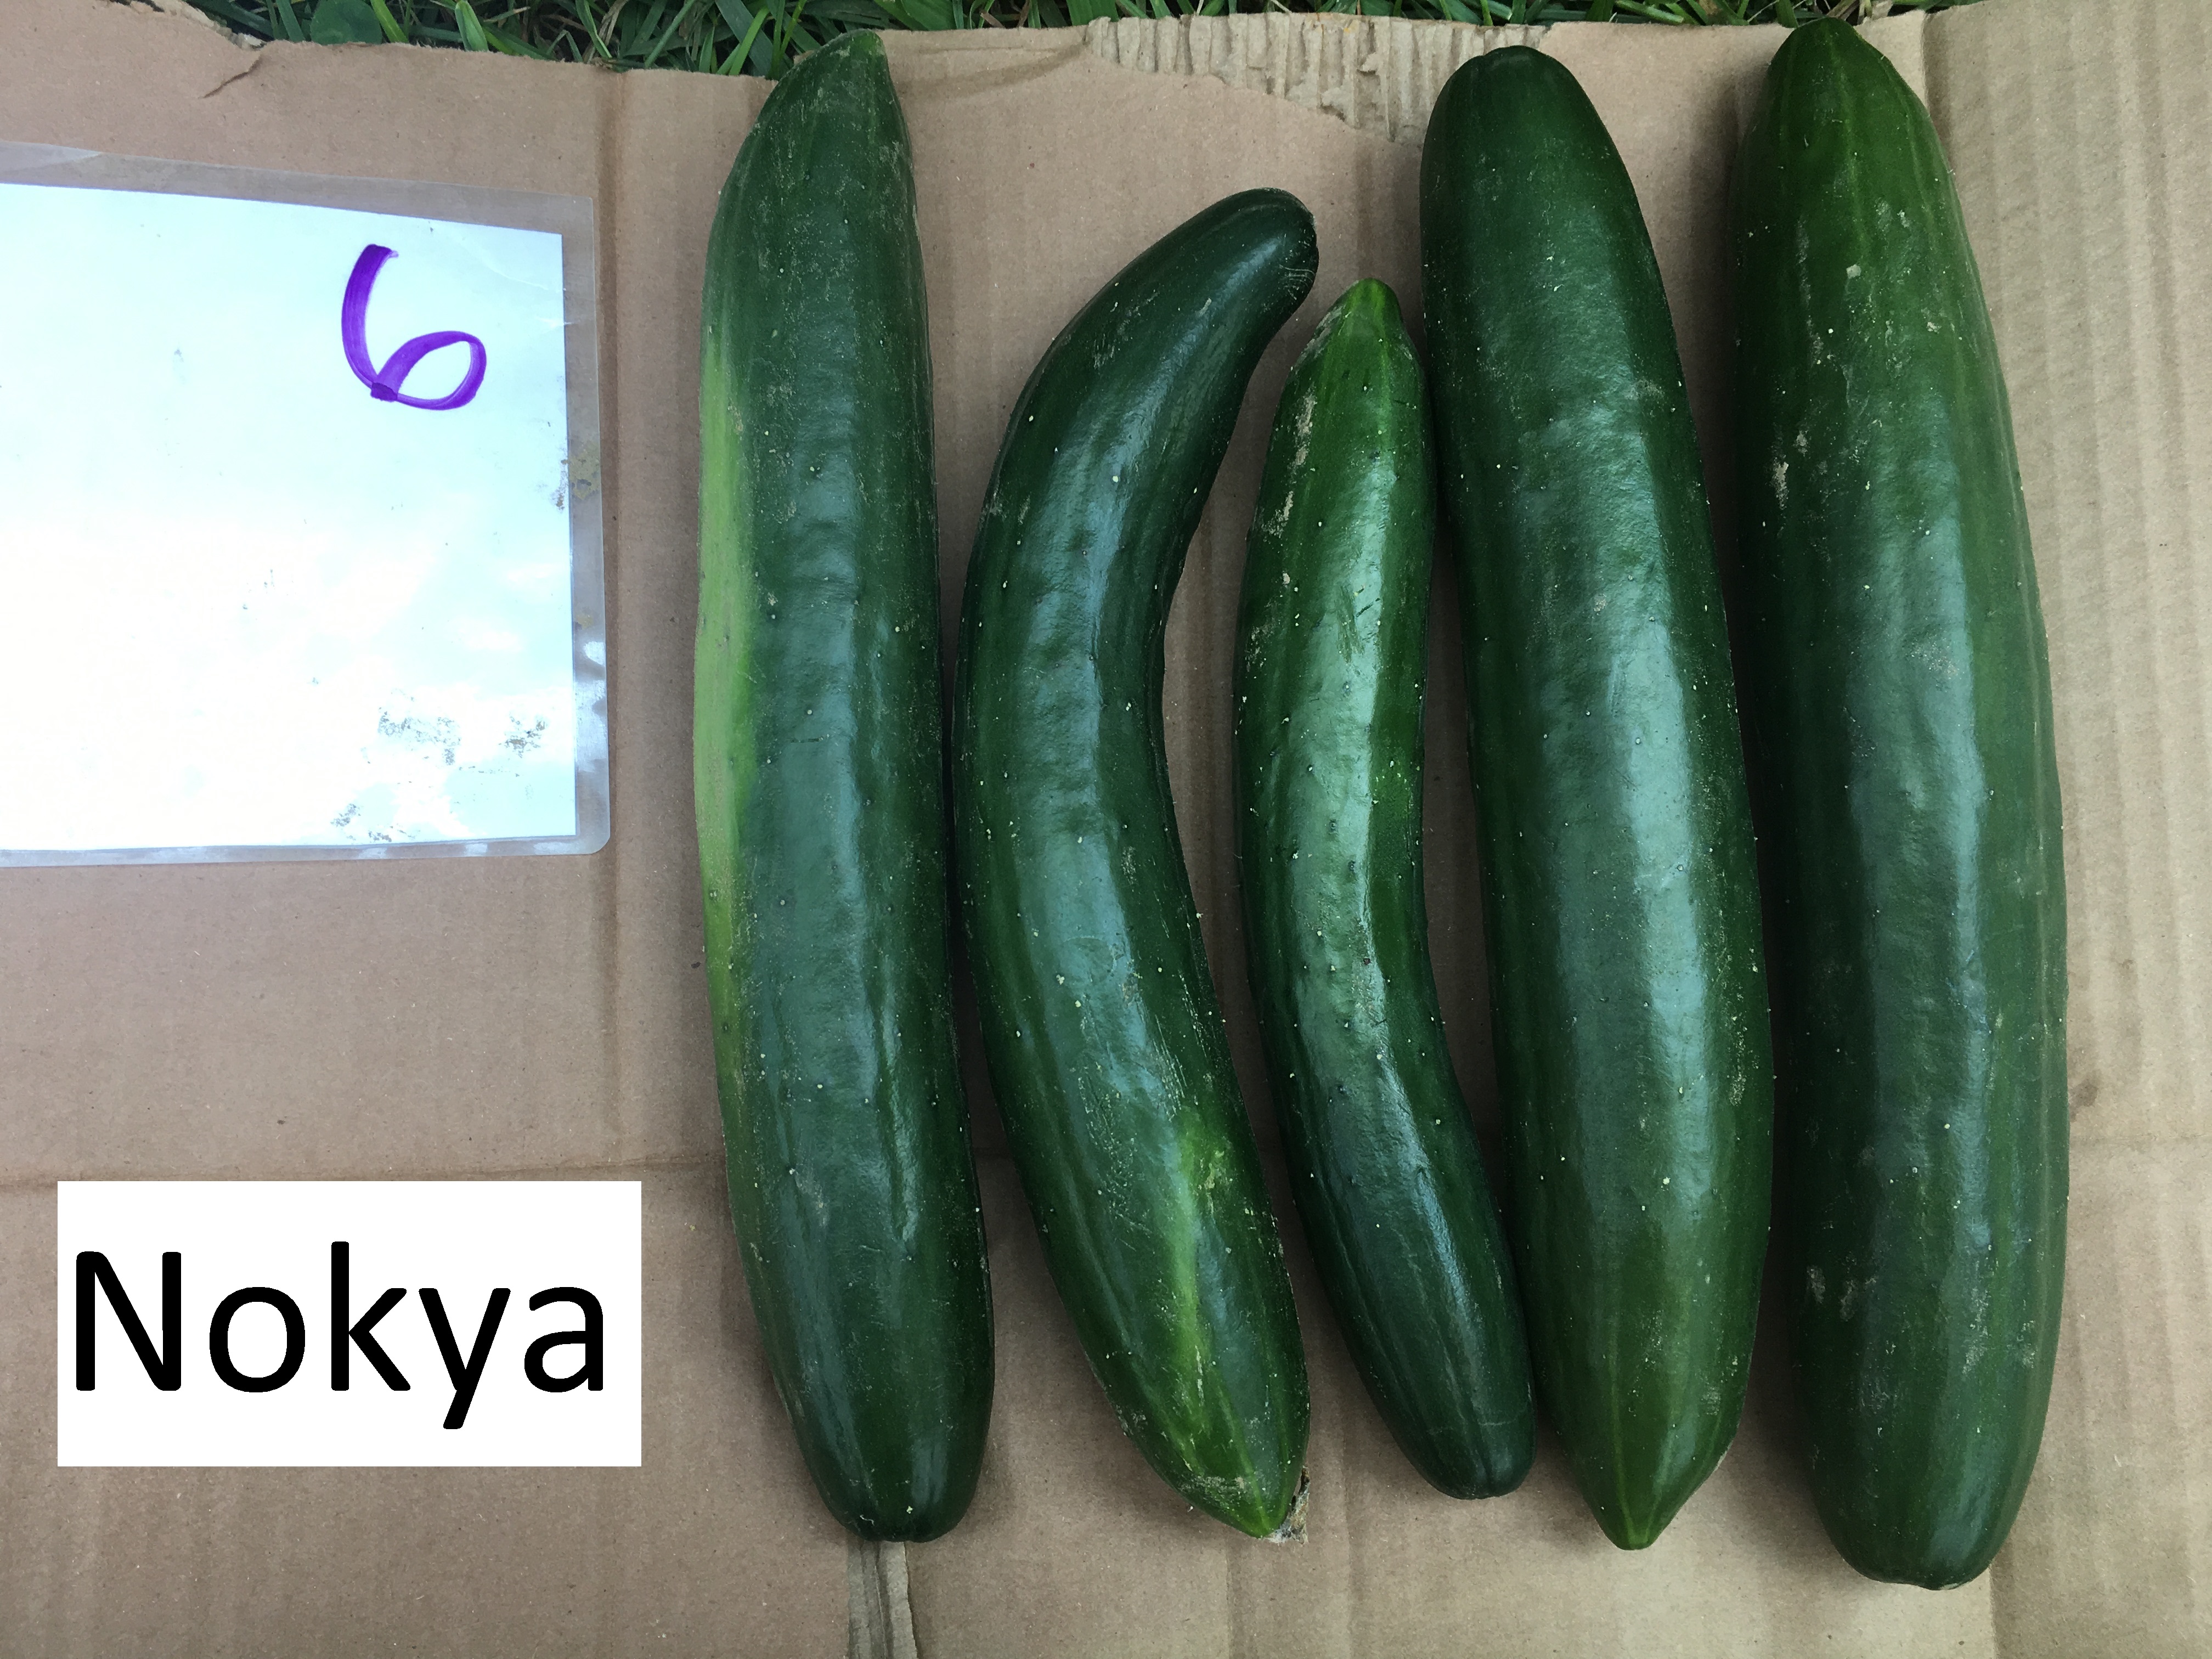
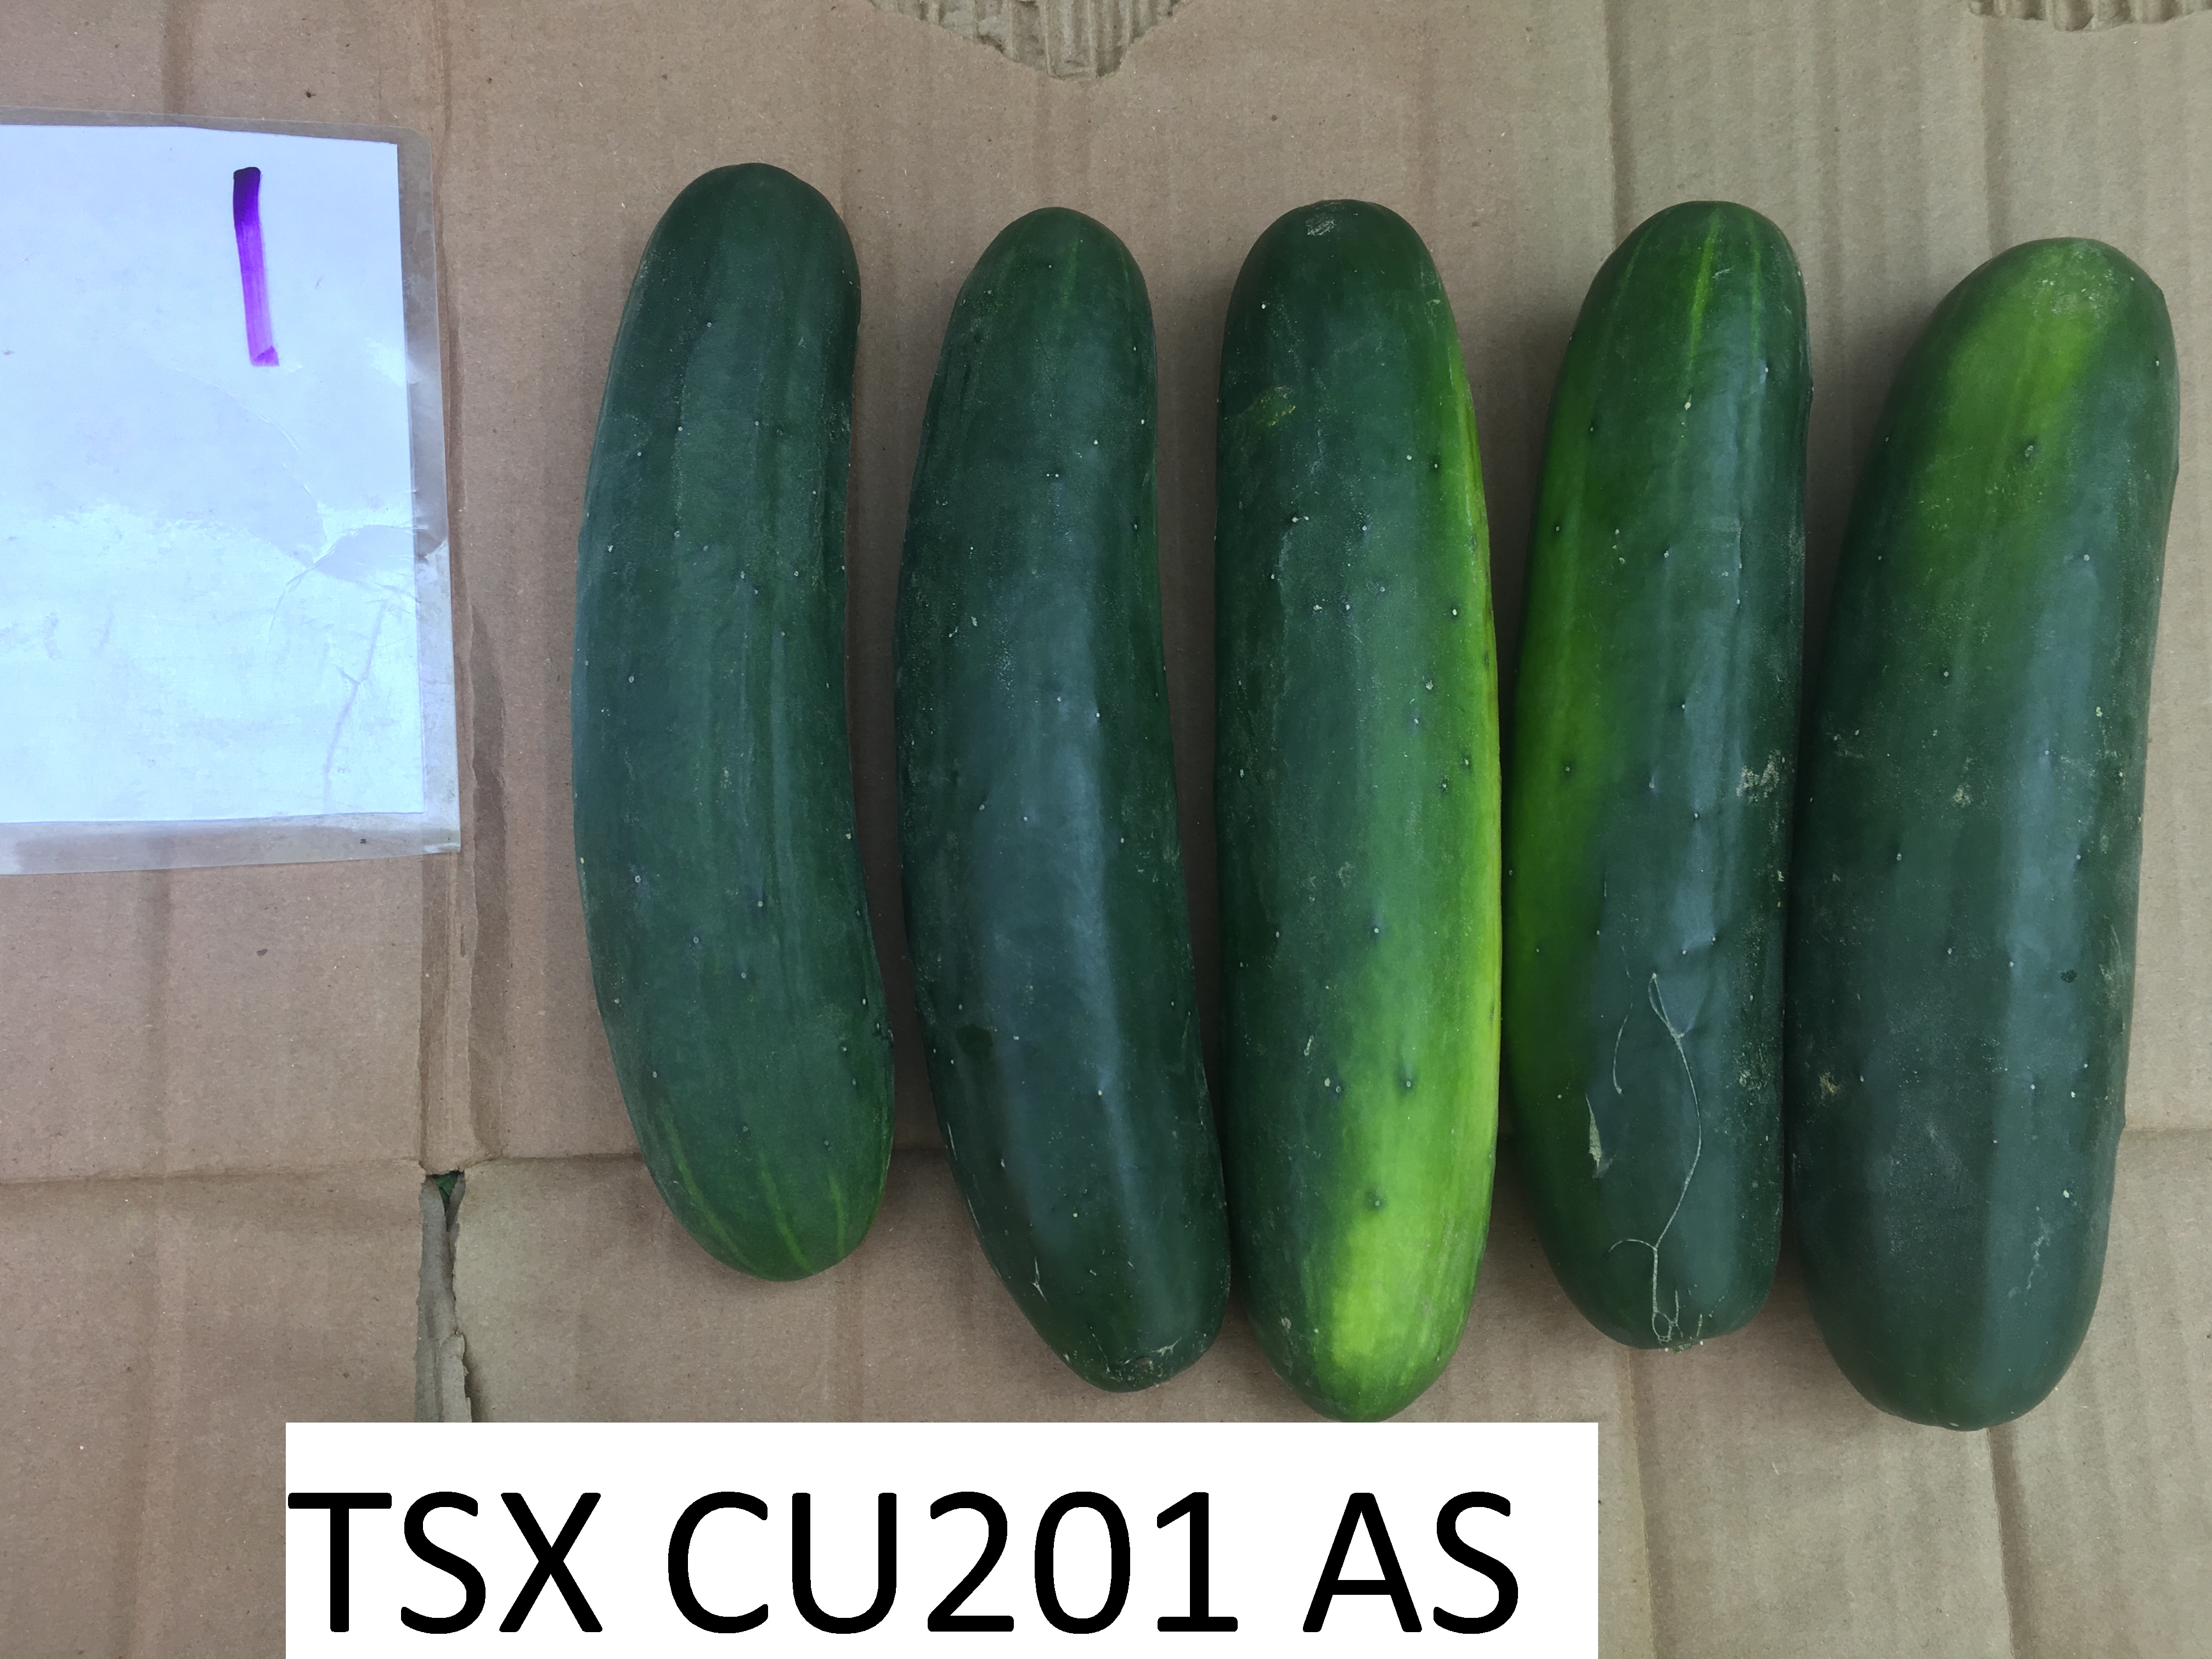
Natural inoculum of PM and DM was the only source of initial inoculum for this experiment. DM symptoms were first observed on 7 Aug in ‘Marketmore 76’ plots and disease pressure was high across the trial by the end of the season, as the cool and wet conditions favored disease development during the study period. All varieties performed better than the commercial standard ‘Marketmore 76.’ ‘Citadel’ had the lowest downy mildew severity and the highest yield. ‘DMR401’ was in a close second but, as in past years, we saw a high level of unmarketable fruit due to abnormalities in fruit shape. ‘Citadel’ is a pickling-type and offers a new option for diversifying fall cucumber markets. ‘Nokya’ is an Asian-type (long and slender shape) which stood up fairly well and may be of interest to growers who have a strong market for this type of cucumber. ‘TSX CU201AS’ also stood out as one that held up longer and had stronger yields, and may be worth considering for development for the fall market.
| table 1. yields and audpc | ||||||||||
|---|---|---|---|---|---|---|---|---|---|---|
| variety name | vendor name | Dm audpcy | Total weight (lbs)z | Marketable weight (lbs) | Ratio of marketable:total Fruit | Harvest period (days) | Late harvest day | |||
| Marketmore 76 | Johnny's | 1514.6 | d | 91.8 | a | 74.4 | b | 81.0 | 31 | 31-Aug |
| TRI CU202G | Tokita | 1216.3 | cd | 117.1 | bc | 70.0 | ab |
59.7 |
35 | 4-Sep |
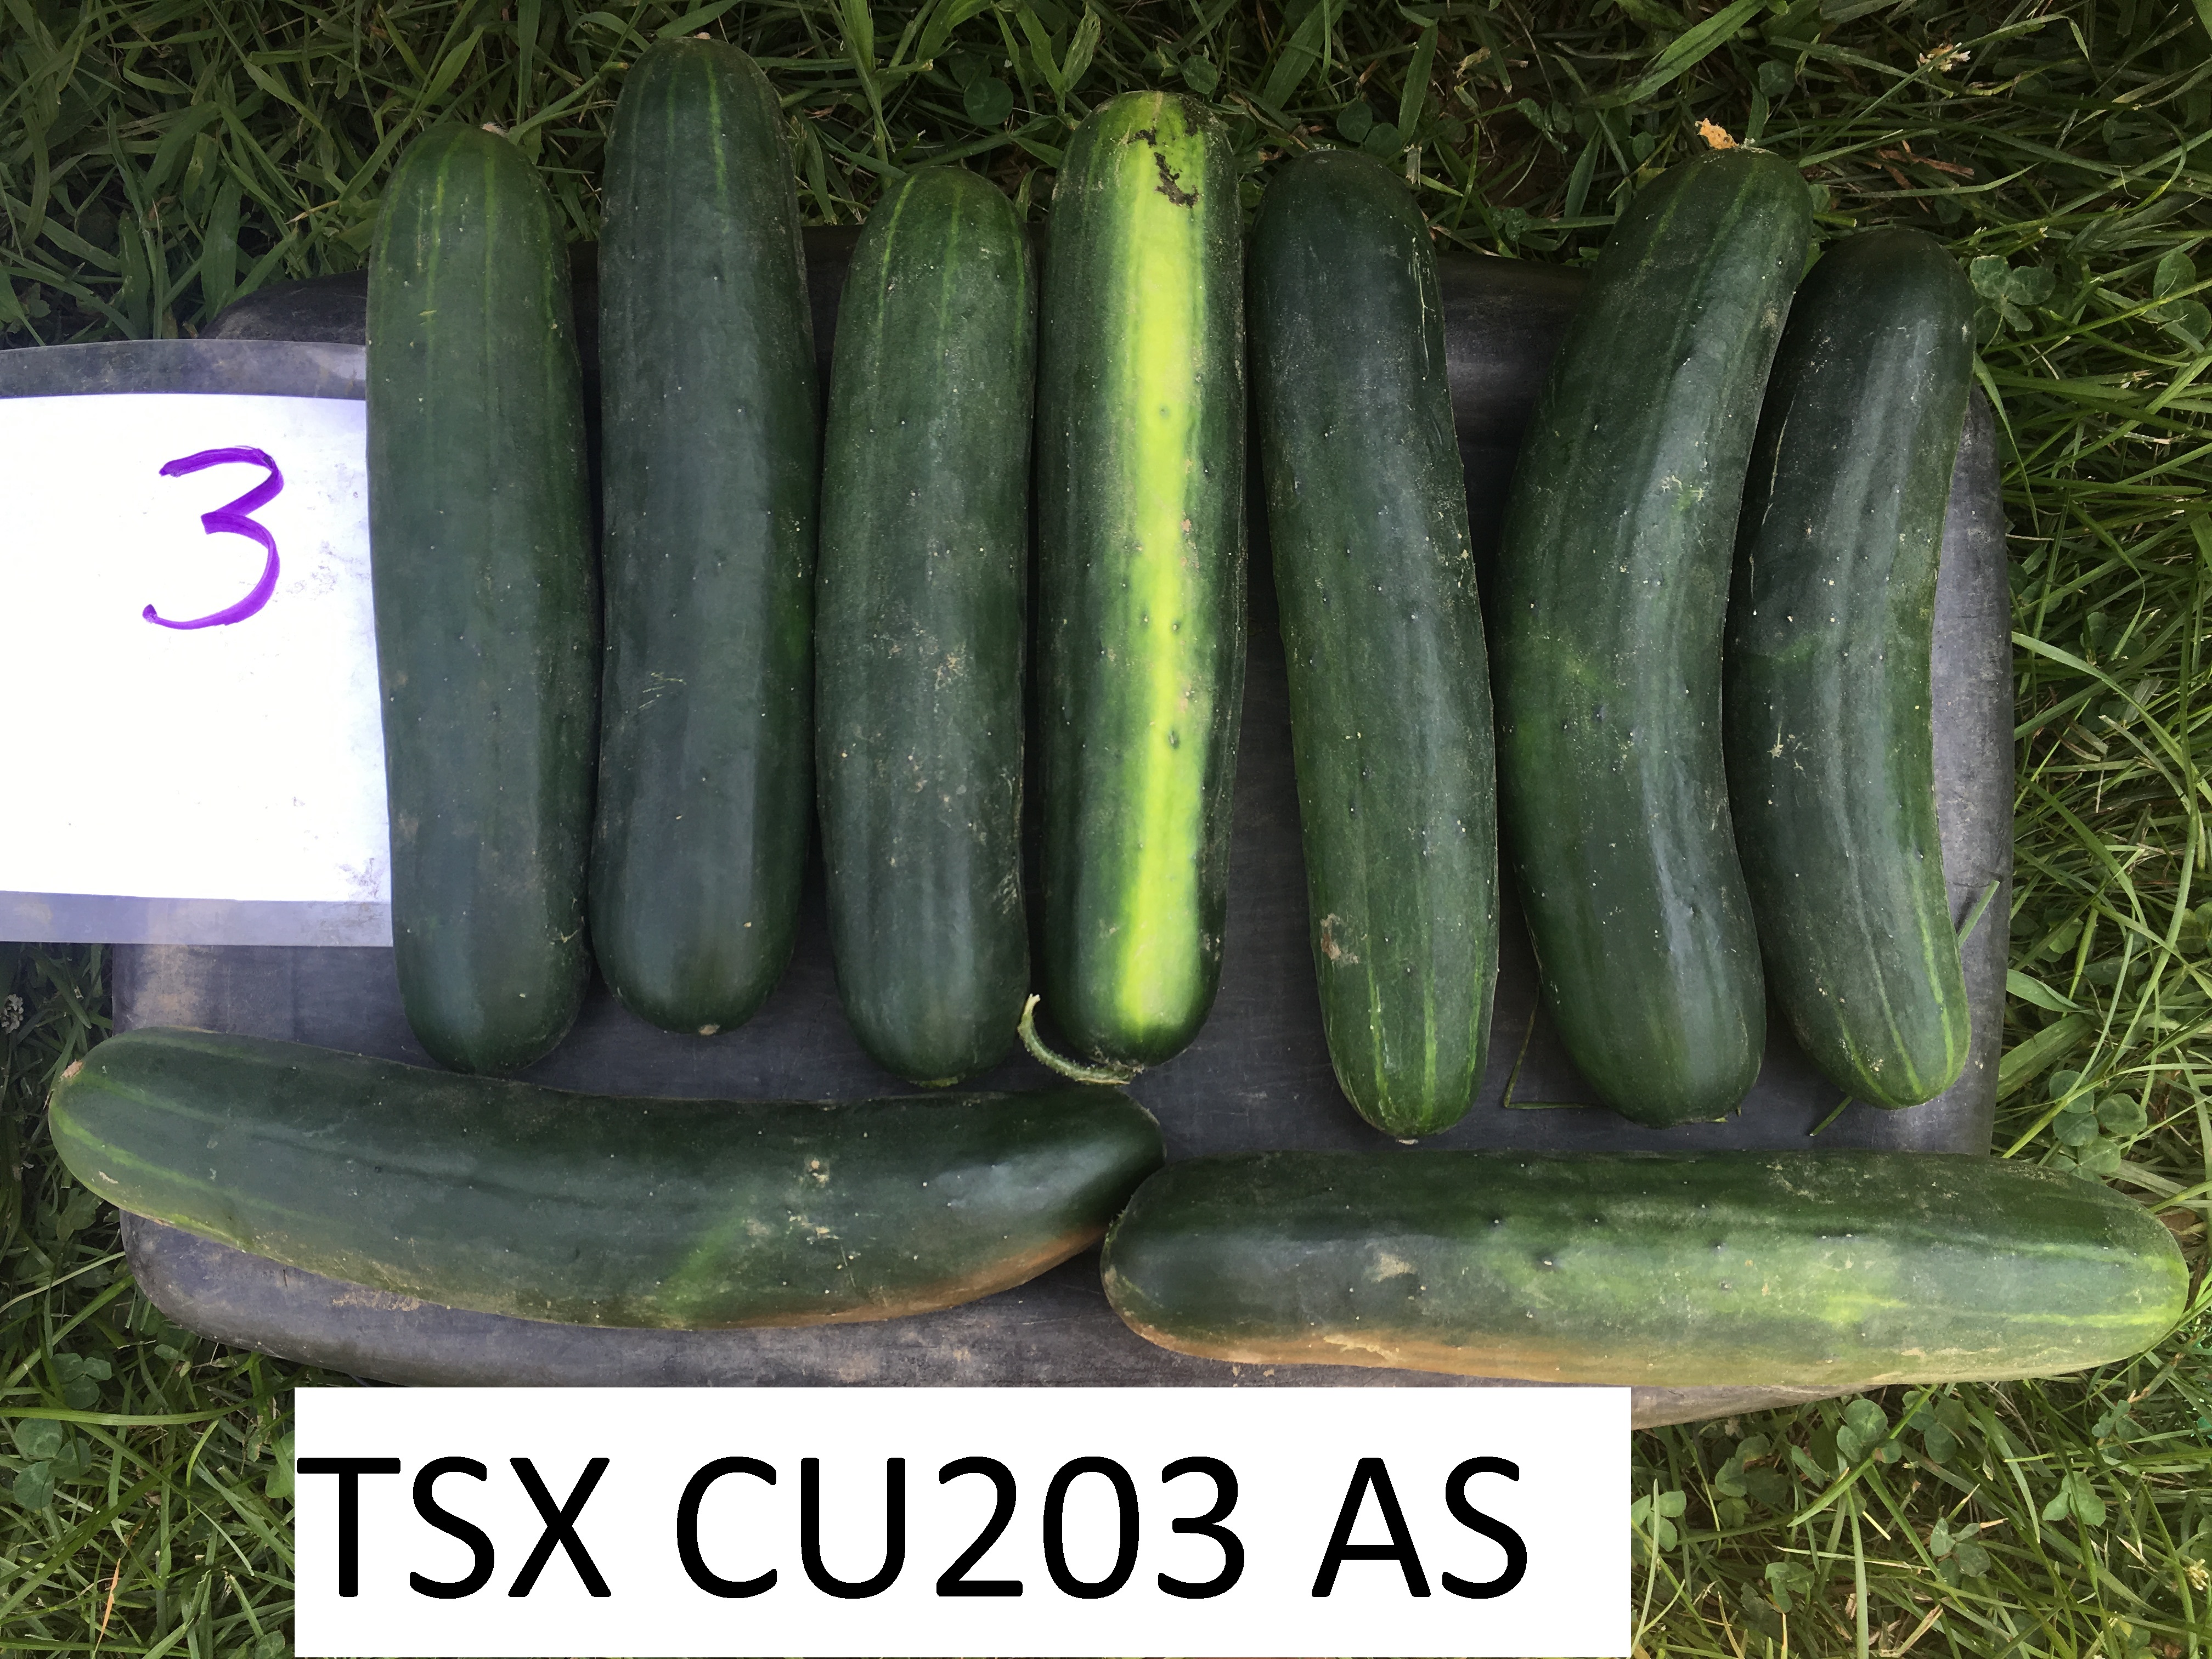
| TSX CU203AS | Tokita | 1201.4 | cd | 106.7 | ab | 73.2 | b | 68.6 | 31 | 31-Aug |
| HSR 5021 | Hollar | 1067.5 | cd | 117.8 | bc | 72.8 | ab | 61.8 | 31 | 31-Aug |
| TSX CU201AS | Tokita | 959.9 | c | 124.8 | c | 89.4 | c | 71.6 | 42 | 11-Sep |
| Nokya | Asia Seed Company | 875.0 | bc | 121.9 | bc | 83.0 | bc | 68.1 | 42 | 11-Sep |
| Citadel | Seminis | 453.3 | ab | 149.5 | d | 122.7 | d | 82.1 | 42 | 11-Sep |
| DMR 401 | Common Wealth Seed | 432.5 | a | 108.5 | abc | 58.6 | a | 54.0 | 35 | 4-Sep |
| p-value | 0.0005 | <0.0001 | <0.0001 | |||||||
|
yData were analyzed using PROC GLM and means were separated using Tukey's HSD. Numbers within each column followed by the same letter are not significantly different from each other. zTotal and marketable yields were recorded twice weekly and are here summed across the whole season. |
||||||||||
This research was funded by Johnny’s Selected Seeds and the New England Vegetable & Fruit Growers’ Association.